Now, there's a story about how they were directly manipulating the market from 2005 onwards, which is very worrying, and has been the focus of most anger. Almost as a footnote, the BBC note
And between 2007 and 2009, during the height of the banking crisis, the staff put in artificially low figures, to avoid the suspicion that Barclays was under financial stress and thus having to borrow at noticeably higher rates than its competitors.
But what are the broader implications? Who did this harm specifically? During the financial crisis, Barclays managed to recapitalise without accepting significant state ownership - unlike RBS and Lloyds. Is it possible it avoided this simply because it was lying about the numbers?
On the other hand, perhaps, as suggested elsewhere, Barclays are simply the first to 'fess up and other banks were also in on it. Why then, collectively, did they do this? For how long have they been doing it? Was the sudden jump in LIBOR in 2008 that precipitated so much panic actually an unacknowledged adjustment to honest values? If so, wouldn't we have had much more warning if rates had started rising sooner?

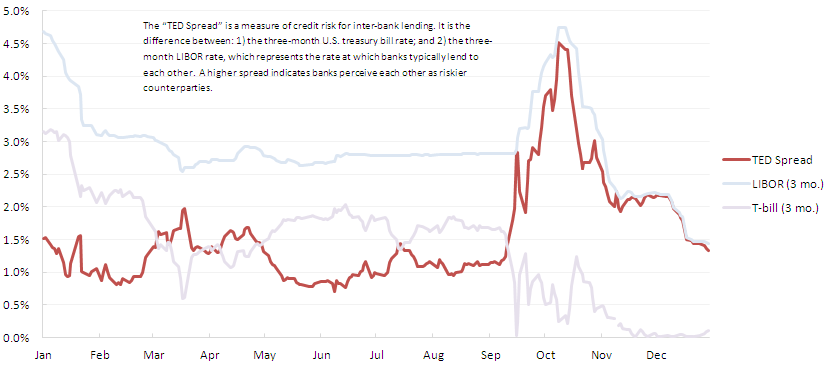
This chart from Wikipedia shows the LIBOR rate in 2008. It spiked in September, at about the time that Lehman Brothers went kablooey, but had been curiously flat for the three months before then.
It seems strange to find articles like this, and this, with Barclays and others openly talking about the problems with LIBOR, but it does support the "informant" theory. According to that last one:
The BBA said last month [April 2008] that it would throw out any member found deliberately understating rates.
No prizes for guessing whether that's really going to happen.
I'm really finding your posts interesting, but I'm finding that graph painful to read. I noticed it's on wikimedia commons, so I should be ok to redesign it and reupload it, but I can't seem to find the raw data behind it.
ReplyDeleteDo you have any idea how I'd go about doing that?
Thanks! That would be awesome. Data appears to originally come from the BBA's website, but has succumbed to bit-rot. Luckily, Internet Archive has it:
Deletehttp://web.archive.org/web/20081226233253/http://www.bba.org.uk/bba/jsp/polopoly.jsp?d=141&a=11948
Done. Used a different source for LIBOR data.
ReplyDeletehttps://commons.wikimedia.org/wiki/File:TED_Spread_Chart_-_Data_to_9_26_08-rebuilt.png
New LIBOR Source:
http://mortgage-x.com/general/indexes/wsj_libor_history.asp?y=2008
Ta. Updated the image in the article. That flatness really stands out, doesn't it?
Delete